Dusky-footed Woodrat (Neotoma fuscipes)
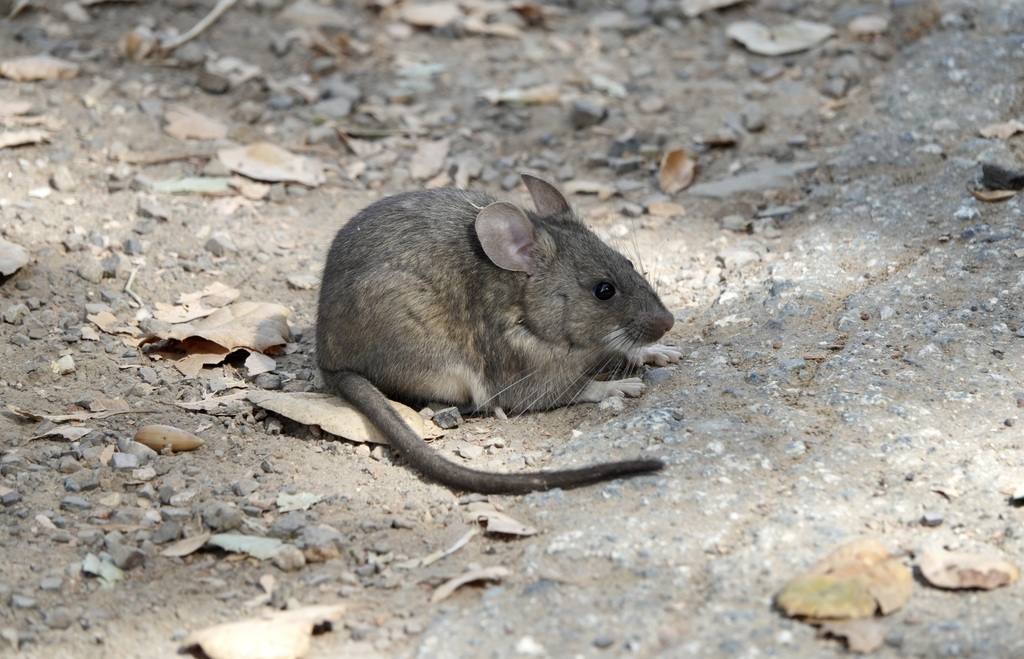


The dusky-footed woodrat is a nocturnal rodent native to California that is also known as a packrat because they will collect objects they find to build and decorate their houses. Woodrat houses usually look like a domed pile of sticks, but have rooms with dedicated purposes inside and houses can be decades old and passed down to generations of woodrats.
What metrics determine the health of this indicator?
Metric 1
Woodrats and/or their nests are present in 50% of forested parks and/or land units in Network partner lands.
Caution
Unchanging
Low Metric 1
Woodrats and/or their nests are present in 50% of forested parks and/or land units in Network partner lands.
Geographic Area


Condition Thresholds
Good
Woodrat present in 50% of monitored forested parks or land units within each subregion as documented in a three-year time period.
Caution
Woodrat present in less than 50% but more than 25% of monitored forested lands, or declining from baseline by 10% to 40%, in a three-year year period.
Significant Concern
Woodrat present in less than 25% of monitored forested lands and/or declining from baseline by more than 40% from original baseline within a three-year period.
Metric Current Health Findings
Current Condition
Current condition is Caution based on the average of all conditions below:
- East Bay Hills: Good. Based on the aggregated records from the analysis, the East Bay Hills subregion had 60% of monitored parks or land units with detections, which exceeds the “good” threshold.
- Mt. Diablo Range: Significant Concern. Based on the aggregated records from the analysis, Mt. Diablo had 0% with detections from the monitored lands, which meets the “significant concern” threshold.
- Mt. Hamilton: Caution. Based on the aggregated records from the analysis, Mt. Hamilton had 25% with detections, which meets the “caution” threshold.
Current Trend
Current trend is Unchanging:
- Mt. Hamilton: Unchanging. The Mt. Hamilton subregion had several years in row of camera detections (2013–2018).
- East Bay Hills, Mt. Diablo Range: Unknown. Without a time series from consistently monitored lands, a trend could not be assessed.
Current Confidence
Current confidence is Low. We used the data (records) that were available to determine detections for this assessment but monitoring is not sufficiently comprehensive in terms of the amount of Network partner lands monitored. Additionally, it is unclear if woodrats were recorded from camera trapping images, which makes the data for this species potentially unreliable.
Rationale - Why It's Important
The presence of woodrats and/or their nests in forested habitats is a measure of ecosystem health. As a keystone species, woodrats provide prey for nocturnal predators, and their nests provide shelter for numerous taxa.
Goal
Woodrats and/or their nests are present in 50% of forested parks and/or land units in Network partner lands.
Baseline Description
Camera records from monitored parks on Network partner lands were compiled, although some of the monitored sites lacked suitable habitat. The lack of records from Sibley Volcanic and Tilden may reflect that the cameras did not detect woodrats or that they were not recorded (identified during the image review process) because they were not a target species for the carnivore research studies from which the camera data was collected. Woodrats were detected in three of five (60%) monitored parks or land units in the East Bay Hills subregion. They were detected in EBMUD lands, but there were no records from Sibley Volcanic or Tilden. Woodrats were detected in the Ohlone Wilderness in the Mt. Hamilton subregion but not detected in monitored parks in the Mt. Diablo Range subregion.
Metric 2
Woodrat abundance remains stable or increases in monitored forested units.
 Unknown
Low
Unknown
Unknown
Low Metric 2
Woodrat abundance remains stable or increases in monitored forested units.
Geographic Area
Condition Thresholds
Good
Woodrat abundance is stable or increasing in monitored forested Network partner lands in each subregion as established by detection rates (woodrat detections per 100 camera trap nights) and/or occupancy estimates (a reliable surrogate for abundance), evaluated in three-year cycles and because some fluctuations can be expected, declines less than 30% are acceptable (still in the “good” condition).
Caution
Woodrat detection rates and/or occupancy estimates decline by more than 30% from the baseline (Year 1 values) over a three-year cycle.
Significant Concern
Woodrat detection rates and/or occupancy estimates decline by more than 50% in any one year or season from baseline (Year 1 values), or after three years of a stable trend.
Metric Current Health Findings
Current Condition
The condition is Unknown at this time due to a lack of data.
Current Trend
The trend is Unknown at this time due to a lack of data.
Current Confidence
Our confidence is Low because we have insufficient data to assess condition or trend.
Rationale - Why It's Important
This metric is being used as a measure of ecological health because stable or increasing woodrat abundance indicates that the species has the resources it needs to persist and can therefore also support other species that rely upon it. This metric depends on camera trap detection rates (an intensity-of-use measure) and occupancy estimates (a surrogate for abundance) to measure trends.
Goal
Woodrat abundance (detection rates and/or occupancy estimation) remains stable or increases in monitored forested units (as measured by camera trapping efforts).
Baseline Description
We cannot provide a baseline at this time; however, ongoing processing of existing and forthcoming camera images will provide the data we need to do so in the future. These data will represent Year 1 values for this metric’s condition thresholds.
Metric 3
Woodrat nest density and percent of active nests remain stable or increase in at least one monitored Network partner land area per subregion.
Unknown
Unknown
Low Metric 3
Woodrat nest density and percent of active nests remain stable or increase in at least one monitored Network partner land area per subregion.
Geographic Area
Condition Thresholds
Good
Woodrat nest density and percent active remain stable or increase in a three-year cycle from the baseline to establish trend in each subregion; because some fluctuations can be expected, declines of less than 30% are acceptable (still in the “good” condition).
Caution
Woodrat nest density and percent active decrease by more than 30% in any one subregion in a three-year cycle from the baseline.
Significant Concern
Woodrat nest density and percent active decrease by more than 30% in two or more subregions in a three-year cycle from the baseline.
Metric Current Health Findings
Current Condition
Current condition is Unknown. Recent, reliable, and comprehensive monitoring data about nest density and percent active were not available to evaluate condition threshold or current condition.
Current Trend
Current trend is Unknown. Recent, reliable, and comprehensive monitoring data about nest density and percent active were not available to evaluate condition threshold or current condition.
Current Confidence
Current confidence is Low. Recent, reliable, and comprehensive monitoring data about nest density and percent active were not available to evaluate condition threshold or current condition.
Rationale - Why It's Important
Woodrat nests are important for the numerous other species that use them for shelter and food. This can be measured by recording woodrat-nest density and determining the percent active, which provides additional data about local woodrat populations and their stability. As mentioned, woodrats are critical to forested ecosystem health in part as an important prey resource for nocturnal carnivores. Selected Network partner lands can be used as proxies for this metric within a given subregion because determining woodrat density and percent active for the entire area of focus is not feasible. However, monitoring smaller areas on an annual basis is an attainable goal.
Goal
Woodrat nest density and percent of active nests remain stable or increase in at least one monitored Network partner land area per subregion.
Baseline Description
The current baseline is unknown for all subregions. A relatively recent monitoring effort conducted by EBMUD (EBMUD 2007, 2008) that surveyed presence and population density at three reservoirs (Briones, San Pablo, and Upper San Leandro) found that both the number of nests and number of active nests increased by 20% from 2002 to 2008. Another published study from the East Bay Hills subregion from Lake Chabot Regional Park (Shabel 2014) measured a woodrat nest density remarkably similar to that from a 1937 study in the Berkeley Hills (Vestal 1938). These findings from the East Bay Hills subregion provide some support that woodrat nests are present and potentially stable or increasing, and based on one study, similar to historical densities. However, these studies are 14 and eight years old, respectively. The current baseline remains unknown. Recent data are needed from the three subregions to provide information about the contemporary condition and trend of this metric.
About this Indicator
The San Francisco dusky-footed woodrat (Neotoma fuscipes annectans) is one of eleven subspecies of the dusky-footed woodrat (Neotoma fuscipes) and is found throughout the San Francisco Peninsula and inland to the East Bay Hills (Matocq 2002). Considered a California species of special concern by CDFW, San Francisco dusky-footed woodrats and its nests provide critical resources to members of both lower and upper trophic levels in forested and shrubland ecosystems. They require moderate canopy with brushy understory.
Why is This Resource Included?
As ecosystem engineers, woodrats construct nests that provide shelter for numerous other taxa, including small rodents, lizards, snakes, and insects, spiders, and other invertebrates. These large terrestrial stick houses can last 20 or more years (Linsdale and Trevis 1951) and are easily detected. Additionally, this species is a key component in the food web for nocturnal forest-dwelling species such as the bobcat (Lynx rufus), gray fox (Urocyon cinereoargenteus), and owls. For these reasons, this mammal was chosen as an indicator for the health of forested and shrubland ecosystems in the Network’s area of focus.
Desired Condition and Trend
The desired condition is that at least 50% of forested units (land units and parks in the Network partner lands that support forests) have at least one woodrat detection, with the desired trend being that a percentage of these forested units continues to meet or exceed this condition threshold. Also, that occupancy estimates from active camera studies show a stable or increasing trend from a baseline set in the first year. Finally, we would like to see woodrat nest density and percent active remain stable or increase in monitored areas (in at least one per subregion), as measured by protocol survey methods at established sentinel sites.
Current Condition and Trend
Woodrat and woodrat nest presence and distribution data for the 51 sq km of forests and 96.5 sq km of shrublands (habitat areas were determined using CLN 2.0 vegetation layer) within the area of focus used in this analysis came from the compiled Network partner agency records and published and unpublished woodrat nest studies. Based on these records, the woodrat was reported in the East Bay Hills subregion (Lafayette and San Pablo Reservoirs) and in the Mt. Hamilton subregion (Ohlone).
Supporting data included East Bay Municipal Utility District (EBMUD) presence and population density surveys from three reservoirs in the East Bay Hill subregion (Briones, San Pablo, and Upper San Leandro). These surveys consisted of detecting nests and determining the likelihood of activity as a proxy for population density. They found that both the number of nests and the number of active nests increased by 20% from 2002 to 2008.
Published woodrat nest densities (Shabel 2014) from the East Bay Hills subregion show similarities to those historically recorded. In this small study, conducted at Lake Chabot Regional Park, researchers found 167 woodrat nests in a 2.8 hectare (ha) (7-acre) study area. This equates to approximately 59 nests/ha, which is remarkably similar to the density of 57 nests/ha found in the late 1930s in the Berkeley Hills (Vestal 1938). As a point of comparison, higher nest densities have been reported in other parts of the Bay Area (not in the area of focus), with up to 92 nests/ha on the Stanford University campus (Bravo 2016) and 75 nests/ha in oak woodlands (Laudenslayer and Fargo 1997). Other reported nest densities are lower, especially in other habitats. For example, chaparral averaged four nests/ha and riparian habitat, 42 nests/ha; grasslands do not provide habitat for woodrats (Bravo 2016). High woodrat nest density in a given area may not necessarily indicate high woodrat population size, in part due to the incidence of unoccupied nests (Laudenslayer and Fargo 1997, Fargo and Laudenslayer 1999).
The current condition, trend, and confidence are the average of the condition, trend, and confidence for the woodrat in each subregion. The suite of metrics was combined to obtain this current condition and trend. These metrics are how we are measuring the difference between what is described in this section (i.e., how things are now) and the desired condition and trend in the preceding section (i.e., what we think “healthy” is for this indicator).
Stressors
Direct Human Impacts
Habitats that support woodrat nests within the area of focus are disturbed by construction, fuel management, and other activities (e.g., road and trail infrastructure maintenance). For some regulated projects, mitigation for unavoidable disturbance to woodrat nests typically means relocating nests. This likely results in an unspecified amount of woodrat mortality due to increased exposure to predation (they no longer have a nest to return to, or if moved with their nest they are in an unfamiliar place) and potential competition with other woodrats in an unfamiliar range.
Fire Regime Change
Wildfires can destroy nest structures and the twigs and leaves used in the construction of those nests.
Habitat Disturbance/Conversion/Loss
Disturbance to forested and shrubland ecosystems due to rural and suburban development, including reduction and trail building, would likely reduce suitable woodrat nesting habitat and woodrat carrying capacity through permanent habitat loss, as well as habitat fragmentation.
Historical Impacts
Loss of contiguous wooded areas with chapparal due to roads, trails, and fire control (fuels management) decreased available habitat and likely lowered the overall carrying capacity for woodrats. Unregulated and widespread use of rodenticides likely decreased abundance historically.
Predation/Competition
Woodrats in areas adjacent to agriculture or suburban development might be more likely to encounter introduced predators like cats on the landscape.
Pollution/Contaminants
Rodenticides are fatal to woodrats. Woodrats in areas adjacent to agriculture or suburban development might be more likely to encounter rodenticides on the landscape.
Additional Resources
Other Metrics Considered but Not Included
No other metrics were considered beyond those noted in this chapter.
Data Gaps and Data Collection/Management Needs
- Because the San Francisco dusky-footed woodrat is listed as a state species of special concern, potential impacts to this species are considered under CEQA review. In some instances, as a result of this review process, mitigation measures are designed to minimize impact to woodrats and their nests require pre-impact surveys for woodrat nests. Additionally, preliminary surveys conducted for the CEQA review process may include woodrat nest surveys. Results from CEQA woodrat nest surveys are not currently available from Network partners; centralizing access to these data would provide up-to-date information on woodrat nest detections for our metrics.
- Data collection methods on the presence or absence of woodrats and their nests should be standardized to supply date, location, and record type. These records could then be plotted and tallied on an annual basis to measure distribution and presence/absence, which would inform Metrics 1 and 3. Fuel reduction efforts and other ongoing maintenance work are also good sources for these data. Other sources include the Alameda whipsnake survey by-catch; however, these results would need to be sourced, aggregated, and tallied with location coordinates and date information.
- Comprehensive monitoring for this species and their nests has not been conducted within the area of focus. However, if nest location surveys, camera trapping detections, and multiyear monitoring (either specifically for woodrats or where they are detected as by-catch) could be compiled, there is likely enough information to establish (1) confirmed presence, (2) current distribution, and (3) multiyear camera trap detection rates to serve as a baseline against which to measure change over time (trends).
- Camera trapping surveys for which we had records appeared to be inconsistent in recording woodrat images. Including this species in current camera trapping studies and cataloging existing images will provide additional detection data that we can use in this assessment.
Past and Current Management
EBMUD conducted San Francisco dusky-footed woodrat population density surveys at three reservoirs in the East Bay Hills subregion. Current woodrat management includes an East Bay Regional Park District (EBRPD) parkwide protocol outlining avoidance and minimization measures for projects that may impact this species (San Francisco Dusky-footed Woodrat Protocol for the East Bay Regional Park District, January 2019). This protocol was developed in coordination with the California Department of Fish and Wildlife. Furthermore, EBRPD has an ongoing fuels management program that includes felling mature trees, removing understory vegetation by hand, masticating scrub, and burning brush piles. Reducing high intensity fires may also support woodrat populations as wildfire may both directly kill woodrats as well as destroy their homes (Chew 1959).
Potential Future Actions
- Use the additional data sources described here to inform analysis of the three metrics included for this indicator. These sources potentially include fuel reduction activities and other permitted projects that require woodrat nest documentation, Alameda whipsnake survey bycatch data, and camera trap images from previous and ongoing studies.
- Establish sentinel sites to measure woodrat nest density and percent active in each of the subregions. This would establish baseline conditions that could be resurveyed on an annual basis to gauge persistence and trend, providing information needed, in part, to address Metric 3.
- Standardize data collection on woodrat nest location (extant; not nests that are moved or destroyed).
- Use a seasonal occupancy analysis for camera trap data from current research efforts to establish a baseline occupancy estimation that could be used to determine trends. Use camera trap data to construct current distribution maps that would contribute to Metric 1.
Key Literature and Data Sources
For additional information about this indicator including key literature and data sources see NatureCheck