Amphibian and Reptile Diversity


Our native pond-breeding amphibians (California tiger salamander, California newt, rough-skinned newt, western toad, Sierran tree frog, and California red-legged frog) and the western pond turtle are good indicators of ecological health because they depend on a variety of habitats, including ponds and wetlands for breeding and development and uplands for basking, foraging, and dispersal.
What metrics determine the health of this indicator?
Many of these metrics were not assessed by geographic region because this is the first regional data compilation effort and no data for changes in
conditions currently exist. Over time, these metrics will be remeasured and compared to the baseline conditions described here to establish trends in pond quantity and
pond hydroperiod, native pond species presence/diversity, and invasive species distribution.
Metric 1
Number of wetlands and ponds in the area of focus that hold water for approximately six months during a normal water year, which represents enough time for most native amphibians to breed successfully.
Good
Unknown
Low Metric 1
Number of wetlands and ponds in the area of focus that hold water for approximately six months during a normal water year, which represents enough time for most native amphibians to breed successfully.
Condition Thresholds
Good
The total number of ponds in the area of focus is maintained, increases, or declines by less than 10% over the next 10 years and the number of ponds with a six-month hydroperiod in an average water year in the area of focus is maintained, increases, or declines by less than 10% over the next 10 years.
Caution
The total number of ponds declines 10%-20% over the next 10 years, or the number of ponds with a six-month hydroperiod in an average water year declines by more than 10% over the next 10 years.
Significant Concern
The total number of ponds declines by more than 20% in the area of focus over the next 10 years, or the number of ponds with a six-month hydroperiod in an average water year declines by more than 20% in the area of focus over the next 10 years.
Metric Current Health Findings
Current Condition
Current condition is Good. More than 1,100 ponds are distributed throughout the area of focus and almost 500 of these ponds (or more than 40%) likely provide hydroperiods sufficient to support breeding and development of most native amphibian species.
Current Trend
As this analysis used a single year of aerial imagery, trend data are unavailable for this metric. However, due to continuing management efforts, it is unlikely that the total number of ponds decreased between 2009 and 2019. Though pond hydroperiods likely decreased during the peak of the drought from 2014 through 2016, the number of ponds that support breeding 91 amphibian populations during normal water years likely did not change significantly between 2009 and 2019.
Current Confidence
Overall confidence is Low. This metric was analyzed by merging pond datasets and reviewing each pond visually. For those that were determined either wet or dry, confidence is high. However, the condition of the 12% of ponds that were not visible is unknown. Also, the analysis only used a single year of normal precipitation over a 10-year period. This is likely a good estimation of pond hydroperiod in an average water year but does not provide a complete picture of pond hydroperiods over a decade. Also, some variation is expected even when comparing normal precipitation years, depending on where and when rainfall is received and on temperature variability between years.
Rationale - Why It's Important
This metric was evaluated by determining the total number of ponds within the area of focus and then recording how many of those ponds hold water through spring (June) of a normal water year. In a normal water year (rainfall between October 1st and September 30th), based on native amphibian egg and larvae development times, a pond hydroperiod of six months would allow most native amphibian species to have the opportunity to successfully reproduce. However, the timing of seasonal rainfall within a water year may also alter a pond’s breeding suitability for a given amphibian species.
This metric is important in understanding the health of this indicator. All of the amphibian species considered in this assessment breed within pond habitats even though they vary in their life history traits. For example, some native amphibians (such as the western toad) can develop quickly and thrive in habitats with short hydroperiods (<3 months), while others take advantage of perennial water bodies, which allow for longer larval development times. Stokes et al. (2021) found that preserves in Sonoma County with California tiger salamander breeding pools that “held water for at least two months following the breeding season (into late April) even in dry years had substantially lower rates of larval decline.” Rough-skinned newt and California red-legged frog larvae have been found to metamorphose in late summer or fall and even overwinter at perennial sites in the East Bay (Moss et al. 2021, USFWS 2017).
Goal
- Maintain or increase the total number of ponds.
- Maintain or increase the number of ponds that hold standing water long enough for most native amphibian species to successfully breed (i.e., a hydroperiod of approximately six months [January through June] in a normal water year).
Baseline Description
Within the area of focus, the five Network partner agencies manage more than 1,100 ponds that are named or identified in publicly available datasets (SFEI 2017) or in agency-provided GIS data. Slightly more than half of these ponds (n = 665) were surveyed in the field between 2009 and 2019. To compensate for a lack of hydroperiod data, pond hydroperiods were visually evaluated using a single aerial photograph taken in June 2018 (National Agriculture Inventory Program [NAIP] 2018). Each pond was viewed at a scale of 1:1,000 and recorded as wet, dry, or not visible. Any depression seen on the aerial imagery, including ephemeral drainages, was evaluated as wet or dry. Of the 989 ponds that were visible in the final dataset, 44% were deemed to be dry and 44% were deemed to be wet. The remaining 12% of ponds were not visible due to canopy cover or ephemerality. This indicates that almost 500 ponds across the area of focus provided potential breeding habitat for most native amphibians, including those with longer larval development times.
Metric 2
Number of different native species (of any life-stage) detected at each surveyed wetland or pond.
Good
Unknown
Low Metric 2
Number of different native species (of any life-stage) detected at each surveyed wetland or pond.
Condition Thresholds
Good
There is no change or there is an increase in the average pond-species richness at surveyed ponds in any of the subregions in the area of focus.
Caution
There is a more than 0.25-0.5 decrease in average pond-species richness at surveyed ponds in any of the subregions in the area of focus (e.g., East Bay Hills species richness declines from 2.20 to 1.95).
Significant Concern
There is a more than 0.5 decrease in average pond-species richness at surveyed ponds in any of the subregions in the area of focus.
Metric Current Health Findings
Current Condition
The current condition is good. More than 80% of the ponds surveyed (538) had between one and four species. Only one pond in the Mt. Hamilton subregion had all six species, and only ponds within the Mt. Diablo Range and Mt. Hamilton subregions had five species. As expected, the Sierran tree frog was the most frequently encountered pond species, followed by the CRLF. The least common species encountered was the western pond turtle.
Current Trend
This metric combines all data taken during the 2009–2019 period, but because this is the first regional assessment, it is not possible to analyze changes over time.
Current Confidence
Though the patterns of species observations seem consistent with expected observations, such as the Sierran tree frog being observed in a majority of ponds, most of these pond surveys were conducted for either California tiger salamander or red-legged frog. Ideally, timing and methods used to survey for these two species should largely overlap other species’ activity periods; however, the data recorded were focused on the quantity and life stage of these two threatened species. Therefore, data for other pond species may not have been consistently recorded even if they were encountered.
Rationale - Why It's Important
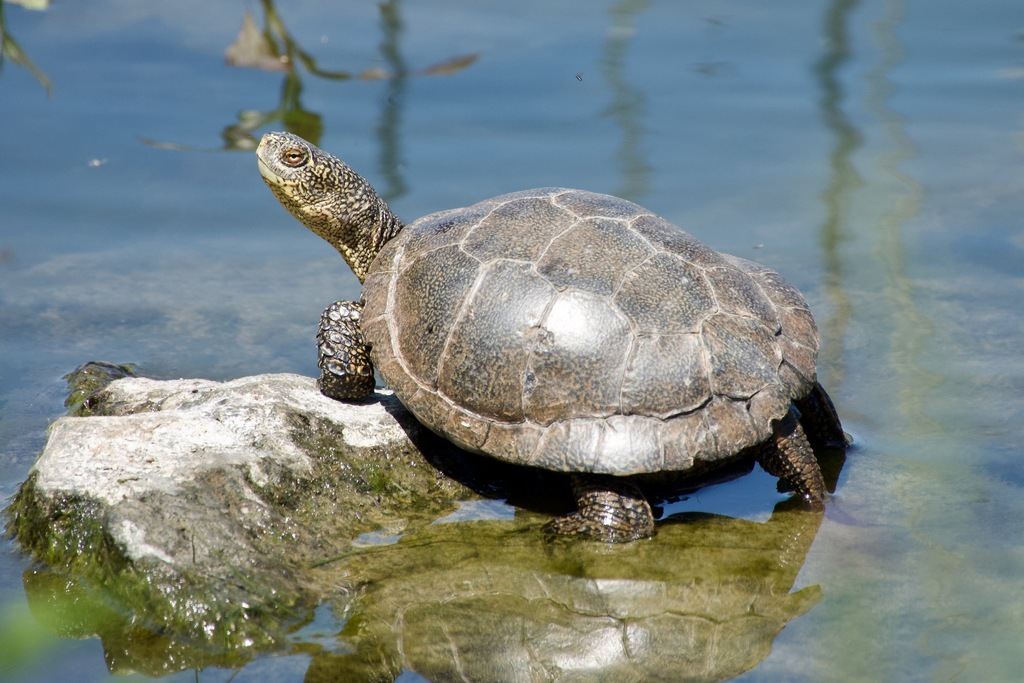
Stability in ecological systems is rooted in biological diversity (McCann 2000). The extirpation of amphibians and reptiles across parts of their range can be correlated to the level of urbanization (Davidson et al. 2001 and 2002, Riley et al. 2005) and other stressors. Monitoring species assemblages can identify species that may be more vulnerable to stressors (Fisher and Shaffer 1996, Hamer and McDonnell 2010, Riley et al. 2005) such as climate change (Ochoa-Ochoa 2012). This metric evaluates the distribution of the native amphibians assessed in Metric 1 and adds the western pond turtle (Actinemys marmorata). Though pond turtles are reptiles and breed terrestrially, they are included here because they are closely tied to aquatic features for foraging and cover and spend much of their lives in and around ponds. Hatchlings and young turtles feed on larval amphibians or invertebrates and adults subsist on aquatic vegetation. They use basking sites, banks, and open water to thermoregulate, and rely on open water to escape terrestrial predators.
Western pond turtles and pond-breeding amphibians are thought to conform to classic metapopulation dynamics, in which patches of suitable habitat within a matrix are occupied on-and-off over time and dispersal between patches buffers populations from extinction. Using a “pond-as-patch” metapopulation model (Marsh and Trenham 2001), we assume that ponds stand in for discrete patches of habitat within a mostly grassland matrix, and we are basing this species composition metric on pond occupancy. However, Marsh and Trenham (2001) argue that the “pond-as-patch” metapopulation model does not neatly explain real-world amphibian population dynamics. For example, it fails to account for the importance of stream corridors and upland habitats for these species. While recognizing the truth of this statement, an evaluation of amphibian and aquatic reptile pond occupancy was chosen as a proxy for amphibian and aquatic reptile health within the area of focus because nearly all of the data available for this analysis were collected from pond surveys.
Goal
- Maintain or increase the number of ponds with more than two species.
- Maintain or increase average herpetological species richness.
Baseline Description
Of the 1,100 ponds in the area of focus, 665 have reliable coordinates and were surveyed at least once between 2009 and 2019. The survey methods included daytime and nighttime visual surveys as well as surveys with dipnets and/or seines. We aggregated surveys to obtain the presence/absence of each species at each pond across the past decade, where a species was considered present if any life stage was detected in any year. The California newt and rough-skinned newt were combined in these analyses because, while they are relatively easy to distinguish as larvae, they are more difficult to tell apart as adults and were often recorded as Taricha sp. The five other species included in this analysis are native, pond-breeding species and our one aquatic reptile (California tiger salamander, western toad, Sierran tree frog, California red-legged frog, and western pond turtle), for a total of six species (for brevity, we will hereafter refer to newts as a single species).
More than 80% of the ponds surveyed (538) had between one and four species. Only one pond in the Mt. Hamilton subregion had all six species, and only ponds within the Mt. Diablo Range and Mt. Hamilton subregions had five species. This is partially due to a range restriction—only one (adult) California tiger salamander has been recorded in the East Bay Hills subregion, so the maximum potential number of its pond species would be five. As expected, the Sierran tree frog was the most frequently encountered pond species, followed by the California red-legged frog. The least common species encountered was the western pond turtle.
Metric 3
Number of wetlands and ponds with American bullfrogs and non-native, invasive fish of any life stage.
 Caution
Unknown
Caution
Unknown  Moderate
 Metric 3
Number of wetlands and ponds with American bullfrogs and non-native, invasive fish of any life stage.
Condition Thresholds
Good
The number of ponds in the area of focus occupied by bullfrogs or invasive fish is maintained or decreases.
Caution
The number of ponds in the area of focus occupied by bullfrogs or invasive fish increases by up to 10%.
Significant Concern
The number of ponds in the area of focus occupied by bullfrogs or invasive fish increases more than 10%.
Metric Current Health Findings
Current Condition
Due to the low occurrence of invasive species across the area of focus and the relatively common and widespread abundance of native pond species such as the California red-legged frog (see species richness in Metric 2), we believe that bullfrogs and invasive fish present a real but manageable threat to native amphibians and turtles. The condition of the Mt. Diablo Range subregion is Good, with less than 2% of ponds occupied by bullfrogs. However, bullfrogs have been detected in more than 15% of ponds in the East Bay Hills and Mt. Hamilton subregions, leading us to an overall condition of Caution. Bullfrog eradication projects are ongoing in these subregions, which will, it is hoped, reduce their presence and their ability to spread.
Current Trend
This metric combines all data taken during 2009–2019 but does not analyze changes over time. In a future trend analysis, we anticipate that the exceptional drought in 2020–2021 may be found to have disrupted successful breeding for bullfrogs and extirpated fish from ponds that are usually perennial.
Current Confidence
As both bullfrogs and invasive fish are easily detected in surveys, we have moderate confidence in these results. We performed a discrete analysis of the effect that bullfrogs and fish have on the California red-legged frog. In that analysis, we found that while the presence of bullfrogs and invasive fish decrease the likelihood of red-legged frog occurrence, this effect was only observed in a few ponds.
In future surveys, recording the species of fish may help us understand how small-fish species like mosquitofish (Gambusia affinis) affect native amphibians and turtles. Differences in fish-species composition are important to track, as larger predatory fish, such as bass, are more likely to have an effect on larval amphibians. We also did not investigate fish and bullfrog occupancy within streams and reservoirs.
Rationale - Why It's Important
This metric assesses the estimated number of ponds within the area of focus that are occupied by invasive American bullfrogs or predatory fish (e.g., bass [Micropterus sp.] or sunfish [Lepomis sp.]).
The analysis of pond hydroperiod for Metric 1 was used in the evaluation of this metric because both fish and bullfrogs require permanent water sources. It is important to include this metric because it is well documented that non-native invasive species contribute to the decline of native amphibians as previously described in the Stressors section of this chapter.
Goal
Maintain or decrease the number of ponds in the area of focus that are occupied by invasive species.
Baseline Description
Of 665 ponds surveyed, 87 (13%) had bullfrogs and 43 (6%) had invasive fish. The Mt. Hamilton and East Bay Hills subregions have similar proportions of ponds occupied by these invasive species, while the Mt. Diablo subregion has very few ponds with bullfrogs and fish. Both of these species require permanent water; bullfrog tadpoles usually need more than a full year to develop, and fish cannot persist without water. As a result, many ponds are seasonal by design to deter colonization by invasive bullfrog or fish. The number of permanent ponds on the landscape is relevant to understanding the potential spread of invasive species. We do not know the total number of permanent ponds in the area of focus because we only assessed inundation in June, nor do we know the total number of ponds containing invasive species, because many ponds were not surveyed. However, it is likely that a subset of the 44% of ponds that held water through June (see Metric 1) continued to hold water throughout the remainder of the water year, and thus could have supported invasive species.
About this Indicator
This ecological health indicator includes the distribution of habitat for, and presence of, all six native pond-breeding amphibians and one aquatic reptile species: the California tiger salamander (Ambystoma californiense), California newt (Taricha torosa), rough-skinned newt (Taricha granulosa), western toad (Anaxyrus boreas), Sierran tree frog (Pseudacris sierra), California red-legged frog (CRLF; Rana draytonii), and northwestern pond turtle (Actinemys marmorata). The distribution of one non-native, invasive amphibian, the American bullfrog (Lithobates catesbeianus), and several species of non-native, invasive fish have also been included in this indicator.
Why is This Resource Included?
Our native pond-breeding amphibians and the northwestern pond turtle are good indicators of ecological health on East Bay Stewardship Network (Network) partner lands because they depend on a variety of habitats, including ponds and wetlands for breeding and development and uplands for basking, foraging, and dispersal. These lands have been divided into three subregions for the purposes of this analysis. Within these subregions, data came from individual parks, reservoirs, recreation or management areas, and other open spaces that we refer to as “Network partner lands”.
This indicator’s health is based on the evaluation of a suite of three metrics that help reveal the current condition of and trends for these species on Network partner lands. These metrics assess pond quality and hydroperiod, species composition and richness, and the distribution of invasive species (American bullfrogs and fish). In addition to assessing current status, another primary goal of the analysis is to provide a benchmark against which managers can measure future changes.
Desired Condition and Trend
Based on available data, amphibian and turtle populations are thought to be stable on protected open spaces within the area of focus. Lacking conclusive data to prove otherwise and considering that the federally listed species are not the rarest, we make the assumption that current condition and trends are equal to desired condition and trends. Maintaining or improving current habitat conditions in the East Bay Hills, Mt. Diablo Range, and Mt. Hamilton subregions will likely lead to sustained native amphibian and turtle populations, absent any unforeseen threats that may arise.
Current Condition and Trend
Using data collected between 2009 and 2019, we found that these indicator species are in “good” condition; however, we were not able to assess trends. A recent paper using much of the same data (Moss et al. 2021) showed that many of our native populations are resilient to drought, with amphibian populations able to recover during normal or above-average precipitation years. However, it should be noted that these analyses did not include the exceptional drought of 2020–2021. Over time, these metrics will be remeasured and compared to the baseline conditions described here to establish trends in pond quantity and pond hydroperiod, native pond species presence/diversity, and invasive species distribution.
Bay Area landscapes have changed dramatically over the past 50 years, becoming more urbanized and in the process, losing habitat. Despite this, parks and open spaces within the area of focus have maintained good habitat for many amphibian and reptile species. For example, a CRLF phylogeographic study comparing coastal Bay Area populations to those in other parts of the range found that CRLF populations in the Bay Area are genetically diverse and gene flow is high (Richmond et al. 2014).
Protected wetlands, stock ponds, and other water infrastructure built to support cattle grazing have provided managed habitats for these species to survive. For all species discussed here, population size and species abundance have likely declined regionally, but extant breeding populations of both common as well as threatened and endangered amphibians and reptiles indicate that suitable conditions remain for these species on Network partners’ lands.
Stressors
Invasive Species Impacts
Non-native species are known to compete with and prey upon native amphibians. For example, American bullfrogs are often implicated in native amphibian declines (Doubledee et al. 2003, Snow and Witmer 2010, Fisher and Shaffer 1996). Introduced fish and crayfish species are also efficient predators of native amphibians and can effectively preclude them from reproducing (Fisher and Shaffer 1996, Shaffer et al. 1993, USFWS 2017). Invasive fish have been found to have a particularly strong negative effect on amphibian occupancy (Joseph et al. 2016). Abandoned pet red-eared slider turtles (Trachemys scripta) are also known to compete with native western pond turtles (Lambert et al. 2019). Finally, terrestrial non-native species such as feral pigs (Sus scrofa) and wild turkeys (Meleagris gallopavo) may adversely affect amphibian and turtle populations directly through predation (Wilcox and Van Vuren 2009, McRoberts et al. 2014) and indirectly through habitat alteration.
Climate Change
The potential effects of climate change on these species’ habitats include shorter hydroperiods, more frequent droughts, more dramatic or unseasonable rain events, and changes in water and air temperatures (Polade et al. 2017, Swain et al. 2018). All of our native species are adapted to seasonal drying, and a few, like the CTS, are further adapted to fairly arid conditions and cyclical drought. However, increases in climatic variability and/or extensive droughts may inhibit successful reproduction or directly cause amphibian and turtle mortality, leading to potential future population declines (USFWS 2017).
Disease
Amphibian diseases have been a focus of conservation efforts in recent decades. In particular, the rapid spread of a fungal pathogen, Batrachochytrium dendrobatidis (Bd), and subsequent extirpations and extinctions have been major causes for concern. An emerging disease, B. salamandrivorans (Bsal), has also been implicated in salamander population declines in Europe. A third fungal pathogen, Emydomyces testavorans (Emte), has recently been observed in western pond turtles in Santa Cruz (Lambert et al. 2021). This fungus causes shell defects and lesions. The health of amphibian populations may also be compromised by ranavirus and parasites such as Ribeiroia ondatrae. To date, Bd, ranavirus, Ribeiroia ondatrae, and other pathogens and parasites have been documented in the area of focus (Hoverman 2012).
Habitat Disturbance/Conversion/Loss
Lands managed by Network partner agencies in the area of focus are generally protected from habitat loss. However, encroaching urbanization, utility/transportation corridors (e.g., loss of upland habitat, road mortality), and competing interests for renewable-energy development (e.g., solar and wind) may affect amphibian and turtle populations within this project’s area of focus (Barry and Shaffer 1994, USFWS 2017).
Additional Resources
Other Metrics Considered but Not Included
- The presence and distribution of these species in creeks, rivers, seeps, springs, or reservoirs. While these habitats are important for many of the amphibians and the turtle, data for them were sparse and difficult to compare.
- The presence and distribution of parasites and disease, such as Bd, ranavirus, Ribeiroia, and Emte. This information exists but has already been evaluated in a published paper (Hoverman et al. 2012).
- Other aquatic reptiles in the area of focus. Species such as the three garter snake species (Thamnophis sp.) for Metric 2 and red-eared sliders for Metric 3 were considered but were not included because data were sparse and not consistently collected.
- For Metric 1, ponds that have a hydroperiod of only three months in an average water year. These ponds could provide habitat for the Sierran tree frog or western toad, but they are unlikely to provide reliable breeding habitat for other amphibian species.
- Short-hydroperiod ponds and pools that may support the western spadefoot toad (Spea hammondii). Its range in the area of focus is highly restricted and we had no existing data to analyze.
Data Gaps and Data Collection/Management Needs
- Our metrics do not account for population estimates. Simple presence and breeding data cannot be easily applied to measures of relative abundance, fecundity, or other measures of population size.
- The survey methodology used by different partner agencies is unlikely to fit into assumptions of statistically robust study designs, and it would be difficult to make assertions about unsampled ponds. Ponds have not been randomly sampled, and uneven sampling decreases statistical power.
- Amphibian diversity can be estimated by presence data, but Network partner agencies have generally conducted targeted-species surveys for the California tiger salamander and red-legged frog. While biologists generally record all amphibians and reptiles found in a pond, the absence of a species in the data is not necessarily indicative of a survey effort with negative findings. To remedy this, a revised data sheet with a checklist for all seven species (separating out the newt species) has been created (an early result of the formation of the Network and these indicator analyses). Network partner agencies will use this revised datasheet to improve data collection in future monitoring efforts. Analyses using data collected from 2021 onward will reflect these data collection improvements in these amphibian communities. For example, increases in amphibian diversity may be due to improvements in the data collected rather than be true additions to species assemblages.
- Some of these data have been collected during visual nighttime eyeshine surveys, which are very good at detecting ranid frogs (e.g., the red-legged frog and American bullfrog) but less so for other amphibians and reptiles. Differences in survey time (nighttime vs. daytime dipnet surveys) and type will influence species captured or identified. Timing of surveys during the year or following major rain events will also affect species observations. Additionally, ponds with repeated surveys are more likely to yield greater species richness, as they can be sampled during multiple species’ peak breeding seasons.
- The California red-legged frog and the Sierran tree frog range throughout the area of focus, but there are likely natural range restrictions for some of the other species. For many of the other native pond species, there is no distinct pattern of decline. However, we do not have detection data in parts of their presumed range. Network partner agencies have not detected:
- the western toad in the north and middle East Bay Hills subregion,
- the tiger salamander in the north and middle East Bay Hills subregion (except for a lone observation in Las Trampas),
- the California newt in the Mt. Diablo Range subregion, or
- the rough-skinned newt in the Mt. Hamilton or Mt. Diablo Range subregions.
- The adverse effects of fish and bullfrogs have been studied, but we have less information on how other non-native species affect amphibians. For example, in a study at Fort Benning, Georgia, feral pigs were documented taking large quantities of reptile and amphibian species (Jolley et al. 2010), but gut content analysis showed that feral pigs in California’s oak woodlands consume mostly small mammals (Wilcox and Van Vuren 2009). The wallowing habits of feral pigs may also affect native amphibians by reducing hydroperiods of shallow ponds (Purificato 2018, personal observation). Wild turkeys consume mostly vegetative matter but have been observed eating vertebrates (McRoberts 2014). Crayfish (red swamp crayfish [Procambarus clarkia]and signal crayfish [Pacifastacus leniusculus]) are also potential CRLF predators (USFWS 2002), as they are known to prey on amphibian eggs and larvae in the lab (Gamradt and Kats 1995).
- Recent droughts may have affected amphibian species in positive or negative ways. The American bullfrog, which requires perennial water to breed successfully, may be extirpated in some areas as usually permanent ponds dry out. However, more frequent, severe, or exceptional droughts such as those experienced in the area of focus in 2014–2016 and 2020-2021 (USDM) are likely to result in poor outcomes for many amphibian and turtle populations. Many of these species are very resilient over a few years of drought (Moss et al. 2021), but in recent years, the increased frequency and severity of drought has been unprecedented. Network partner agencies have documented recent catastrophic losses in newts and pond turtle populations following the exceptional drought of 2020–2021 (unpublished data). In light of potentially extreme precipitation and temperature fluctuations, future analyses will need to take these singular events into account as they attempt to generate robust trend data.
Past and Current Management
Network partner agencies in this area of focus have conducted long-term monitoring coupled with pond maintenance, restoration, enhancement, and creation. These management actions include pond de-sedimentation to lengthen hydroperiods, repairing embankments, removing encroaching emergent vegetation, restoring native vegetation, and removing bullfrogs and fish via periodic draining. Additionally, ponds created on conservation easement lands are monitored postconstruction to meet mitigation requirements.
Potential Future Actions
- Establish more systematic and coordinated data-collection efforts, in which Network partner agencies conduct pond surveys using similar methods and data sheets when possible.
- Continue pond restoration efforts by collaborating on pond restoration priorities, targeting invasive species control where activities benefit multiple Network partner agencies, and improving pond hydroperiods.
- Model a subset of ponds under future climate-change scenarios.
- Consolidate academic disease research across the area of focus.
These actions may increase our confidence in the data used in subsequent analyses; provide greater coverage and more even sampling across the area of focus; help prioritize where pond restoration efforts should be focused; and, in the case of modeling pond hydrology, help partner agencies proactively manage for climate change.
Key Literature and Data Sources
For additional information about this indicator including key literature and data sources see NatureCheck